This post follows up on a previous post on using smoothness to detect appliances. The problem with this method is the large number of false positives it generates in addition to correct appliance matches. The appliances for which this method generates the most false positives are the appliances with low power consumption relative to the aggregate consumption. This post describes the assignment of confidence values to the appliance detections in an attempt to distinguish between true appliance detections and false positives.
Below is a plot of the household aggregate power demand (W) and sub-metered appliances over a 24-hour period. The household aggregate is shown in black, the fridge in blue, the washing machine in green and the dishwasher in red.
 As before, each appliance's signature was subtracted from the aggregate demand in turn, and the smoothness of the resulting plot was calculated. The fridge, washing machine and dishwasher's smoothness plots are shown below. In addition, we want to assign confidence to each of these appliance detections. This confidence value can be approximated using the ratio of energy consumed by the appliance in a typical cycle to energy consumed by other appliances during that time period. We define a confidence function such that:
if aggregate - signature > 0 for all power values
confidence(smoothness value) = SUM(signature_energy) / SUM(aggregate_energy - signature_energy)
else
confidence(smoothness value) = 0
endif
The if condition represents the possible interval heuristic as explained in a previous post. In this case it has been extended to two dimensions, in that a two dimensional power signature is used as opposed to a single value 'on' power value. This ensures that if the aggregate_energy - signature_energy has any value below 0, a confidence of 0 will be given.
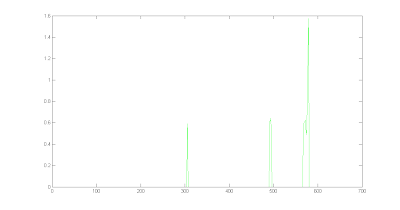
The smoothness and confidence for the fridge, washing machine and dishwasher are shown below.
Fridge:
Smoothness:

This shows that the detections overnight have been assigned a higher confidence than most of the detections during the day, successfully distinguishing the clear positives from the false and unsure positives. In addition, two detections during the day when there were few other appliances operating were assigned a high confidence value. This approach has worked very well for the fridge data.
Washing machine:
This confidence plot is a complete contrast to the fridge's plot. In this case, there are only three instances where the signature can be subtracted from the aggregate signal, each with a fair confidence level. However, the highest confidence is assigned to the third match, while only the first match corresponds to an actual cycle of the washing machine. The reason for this is the first two matches have much higher power peaks than the washing machine would cause, while the shape of the third detection matches the signature well.
Dishwasher:
Smoothness:
 Similar to the washing machine's confidence plot, this provides very little data. A high confidence is assigned to the first match found by the smoothness appliance detector. However, no confidence value is assigned to the second correct detection. This is due to an inaccuracy in the power data collected by either the aggregate or washing machine Plogg.
 As can be seen on the graph at the top of this post, there is a time instant at which the washing machine Plogg records a higher power value than the household aggregate. This should not be possible, as the household aggregate should include the washing machine in addition to all other electrical appliances. This inaccuracy most likely occurred due to a slight discrepancy between the time at which the Ploggs record a certain data value. I assume this was caused by the washing machine momentarily dipping its power draw as it was sampled by the household aggregate Plogg, before increasing its power draw and being sampled by the washing machine Plogg.
Conclusions:
This confidence metric works very well for appliances whose signature is relatively small compared to the aggregate profile. However, the confidence metric adds little information for appliance's whose signature is relatively large compared to the aggregate profile. This is because it is only applicable when the appliance's signature can be subtracted from the household aggregate, and therefore mimicking the 'possible interval' heuristic.


No comments:
Post a Comment
Note: only a member of this blog may post a comment.