Friday, 1 July 2011

Plan for refinement of appliance model

At this stage, there are three potential directions I would like to explore to improve our current model of appliances:

  1. Use of additional data sources (e.g. time of day, weather reports)
  2. Explicit modelling of appliance duration
  3. Steady-state analysis using hidden Markov models
Use of additional data sources

There are data sources available that could increase the accuracy of a NIALM. Examples are the unlikely use of a kettle overnight and the unlikely use of a tumble dryer when the weather is nice.

The model of appliances using HMMs can be extended to include such information. This requires the addition of a new sequence of observed variables, upon which the appliance states are conditionally dependent. This results in an input-output hidden Markov model as is shown below:
where:
  • circles represent continuous variables, squares represent discrete variables
  • shaded represent latent (hidden) variables, white represent observed variables
  • a represents a sequence of an additional data source (e.g. time of day)
  • z represents a Markov chain of appliance states
  • x represents a sequence of appliance power readings
  • T represents the number of time slices
By specifying the distribution of appliance states conditional upon the additional data source, the model can perform more accurate inference over appliance states without increasing the complexity of such inference. The probability of an assignment of values to the hidden variables can be calculated:

Explicit modelling of appliance duration

In the current model, the expected duration of each appliance's operation is modelled implicitly through the transition matrices. Although the transition probabilities are fixed for each time slice, they still determine the expected duration of an appliance when considering a sequence of observations. Consider an appliance with transition probabilities such that it will stay in the same state with probability 0.8 and change state with probability 0.2. We would expect the appliance to change state on average every 5 time slices, and such a sequence would be evaluated with a higher probability than one with state changes every 10 slices.

An alternative approach would be to model the probability of the next transition as conditionally dependent on the current state and its duration. The duration of the current state refers to the number of previous time slices during which the appliance's state has not changed. The graphical model stays unchanged, however the probability of an assignment of values to the hidden variables is now calculated:
where d at time slice n-1 refers to the duration of the current state.

This will complicate inference over the model, however such models have been successfully applied to many fields, including speech, human activity and hand writing recognition.

Steady-state analysis using hidden Markov models

So far we have used the sequence of power readings as the observed variables. Steady-state analysis is an alternative approach which aims to identify continuous states by the lack of change between consecutive power readings. HMMs can also be used for steady-state analysis by using the difference between consecutive power readings as the observed variable, instead of the power readings themselves. Inference over the HMM would remain the same, although the states in the HMM would no longer refer to appliance operating states. Instead, they would represent each possible transition to a new state in addition to a transition to the same state. The lattice diagram below shows the states of an HMM for steady-state analysis:
This above lattice diagram shows all the possible transitions between states. The lattice is fully connected between consecutive time slices, with the exception of consecutive turn on and turn off states. This is due to the fact that an appliance must first turn on before it can turn off and visa versa.

Each state is now responsible for a corresponding observation. For instance, the no change state would be expected to emit an observation close to 0, the turn on state might be expected to emit an observation of 50 while the turn off state would be expected to emit an observation of -50.

Conclusion

All three extension present improvements upon the existing appliance model, and should therefore lead to better appliance power disaggregation accuracy. However, I think the second method which uses semi-Markov models increases the complexity of inference for little gain in accuracy. However, the other two approaches provide significant advantages, in that the first allows predictions to be based on more data, while the second allows only a subset of appliances to be modelled. It should be possible to combine both of these two approaches, and therefore these will constitute a thorough investigation over the next few months.

Thursday, 30 June 2011

9 Month Report: Using Hidden Markov Models for Non-intrusive Appliance Load Monitoring

Today I submitted my 9 month report:

Title: Using Hidden Markov Models for Non-intrusive Appliance Load Monitoring

Abstract: With the global problems of diminishing fossil fuel reserves and climate change comes the need to reduce energy consumption. One approach in the domestic sector is to improve consumer understanding of how much energy is consumed by each of their household appliances. This empowers consumers to make educated decisions on how they can change their lifestyle in an effort to reduce their energy consumption. This report investigates how total household energy consumption can be disaggregated into individual appliances using low granularity data collected from a single point of measurement, such as a smart meter. First, this work discusses how this problem can be solved using combinatorial optimisation. Second, a novel approach is introduced using hidden Markov models to model each appliance. We show through empirical evaluation that our implementation of the hidden Markov model approach outperforms the combinatorial optimisation method. Our future work is then outlined to show how we plan to better model domestic appliances and therefore improve the accuracy of our approach.

Wednesday, 29 June 2011

Using a single hidden Markov model to model multiple appliances

Previous posts have shown how a single appliance's states can be determined from its power readings using a hidden Markov model. This post shows how a single hidden Markov model can be used to determine the states of multiple appliances from their aggregate power readings.

Model definition

The combination of multiple latent Markov chains (representing appliance states) and a single observed variable (aggregate power readings) can be modelled as a factorial hidden Markov model:
A factorial hidden Markov model can actually be transformed to an equivalent standard HMM. Such a model would contain a single chain of latent variables, each of which has as many discrete states as the number of combinations of each appliance's states. For instance, for a FHMM with 3 latent chains of 2, 3 and 4 states each, the equivalent HMM will have 1 latent chain of 24 states. The standard HMM is shown below:

Learning

Before any inference can take place, the model parameters for the combined hidden Markov model must be specified:
  • pi - the probability of each appliance state in time slice 1
  • A - appliance transition probability matrix
  • phi - emission density (probability density of observed variable given a hidden variable)
For training purposes, we assume to have training data for each individual appliance. The model parameters for each individual appliance can be learnt using the Expectation-Maximisation algorithm. The model parameters for each individual appliance must then be combined to a single set of model parameters for the combined hidden Markov model. The model parameters for the combined model are calculated:
  • pi - the product of each combination of individual initial probability
  • A - the product of each combination of transition probability
  • phi - the sum of each combination of emission density
Once these model parameters have been calculated, the model is then ready to perform inference.

Inference

The Viterbi algorithm can be used to infer the most probable chain of latent variables in a HMM given a chain of observations. This is different to sequentially classifying variables according to their maximum probability. This is because the sequential classification method is unable to classify a state which is individually sub-optimal, but leads to a sequence of states which are jointly more probable. Because such classifications are not revisited sequential classification does not guarantee to find the jointly optimal sequence of states.

The complexity of the Viterbi algorithm is linear in the length of the Markov chain. However, its complexity is exponential in the number of appliances modelled. This is because the probability of each transition must be evaluated at each time slice. Since the variables correspond to each combination of all the appliance's states, the number of transitions is exponential in the number of appliances. This is acceptable for small numbers of appliances, but would become intractable for households containing many more than 20 appliances.

Wednesday, 1 June 2011

Calculating the optimal appliance state transitions for an observed data set - continued

This post extends the previous post, by applying the same technique to a multi-state appliance. The classification accuracy was tested using the power demand from a washing machine. The power demand for two cycles of a washing machine is shown below.
Each cycle consists of two similar states drawing approximately 1600 W, connected by an intermediate state drawing approximately 50 W. The intermediate state always connects two on states, and therefore the model should never classify transitions between the intermediate state and off states. This can be represented by the finite state machine below.
The HMM should capture such appliance behaviour. Therefore, it was set up such that the hidden variable has three possible states: 1 (off), 2 (intermediate) and 3 (on). The observed variable now represents a sample from this Gaussian mixture, and the Gaussian responsible for generating each sample is represented by the corresponding latent variable.

The model parameters pi (probabilities of first state), A (transition probabilities) and phi (emission densities) were set up:

  • pi = [1 0 0] - The appliance will always be off at the start of the sequence
  • A = [
             0.9,  0,     0.1
             0,     0.8,  0.2
             0.1,  0.1,  0.8
             ] - The appliance is most likely to stay in the same state, while transitions between off and intermediate are not possible

  • phi = {mean: [2.5 56 1600], cov:[10 10 10]} - The distribution of the emissions of the Gaussian mixture
The transition matrix, A, models impossible state transitions as having probability 0. It also models highly probable transitions within states as close to 1.

After creating the HMM and setting the model parameters, the evidence can be entered into the inference engine. In this case, the evidence is the power demand shown by the graph at the top of this post. Once the evidence is entered, the Viterbi algorithm can be run to determine the optimal sequence of states responsible for generating the sequence of observations. The graph below shows a plot of the state sequence, where 1 = off, 2 = int, 3 = on.
Such a probabilistic approach to state classification has advantages over dividing the power demand using static boundaries. First, the approach is robust to noise, in that variations around a mean demand in the intermediate and on states do not detrimentally affect their classification. Second, samples taken during a transition are typically ignored if no probable transition exists. For instance, one or two samples are captured during the transition between the off and on states. Instead of classifying these as the intermediate state, these are assumed to be noise and correctly classified as the off state.

This approach allows information about the most probable transitions to built into the model given the sequential nature of observations. This is an extension to simply selecting the appliance state most likely to generate the observation.

I intend to investigate how this approach can be extended to multiple appliances in the near future.

Thursday, 26 May 2011

Calculating the optimal appliance state transitions for an observed data set

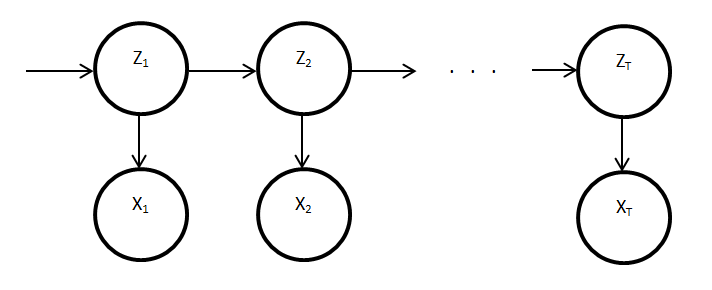
As explained in previous posts, we can model the conditional probabilities of appliance states and aggregate power readings using a Markov chain of latent variables:

where:
  • Zt - discrete latent variable at time t (appliance state)
  • Xt - continuous observed variable at time t (power reading)

This model can be manually trained by specifying the model parameters:
  • pi - probability density of z1 (probabilities of initial appliance states)
  • A - appliance transition probability matrix
  • phi - emission density (probability density of observed variable given a hidden variable)
The problem of non-intrusive appliance load monitoring can be formalised as:
Given a sequence of observed power readings, X, determine the optimal sequence of appliance states, Z, responsible for generating such a sequence.

The probability of a sequence of appliance states and power readings can be evaluated using:
As previously described, the optimal sequence of appliance states can be found using the Viterbi algorithm.

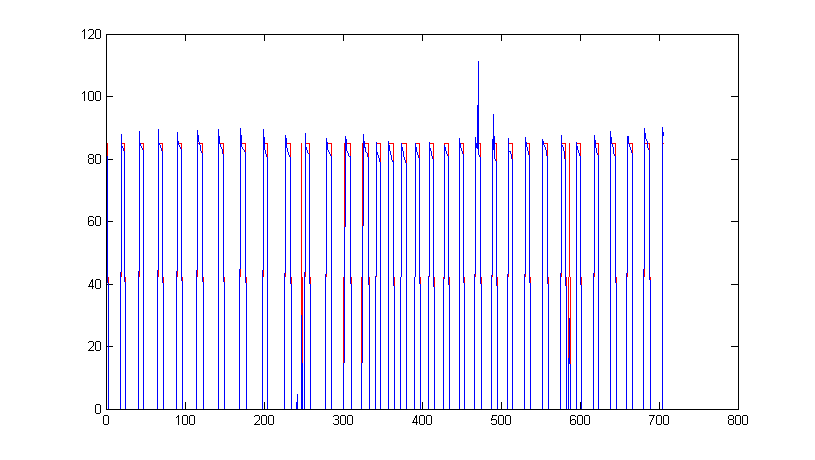
I have used the Bayes Net Toolbox for Matlab to model a single two-state appliance. The model is manually trained by specifying the model parameters pi, A and phi. It is then possible to sample realistic data of arbitrary length from the model. In addition, it possible to evaluate the probability of a sequence of appliance states and power readings. Therefore, the Viterbi algorithm can be used to find the optimal sequence of appliance states for an observed sequence of power readings. I have implemented the Viterbi algorithm and used it to calculate the optimal sequence of states for a fridge, given a sequence of the fridge's power readings. Below is a graph showing the fridge's power reading (blue) and the estimated appliance states (red), where 85 represents on and 0 represents off.
In this case of a single two-state appliance, this approach performs similarly to simply comparing the power samples, p, against a threshold, x, where p > x indicates the appliance is on, and off otherwise. However, using this probabilistic approach has advantages over such a heuristic approach. The threshold method would always estimate the appliance be on if the power reading is above a given value, and therefore treats the data as independent and identically distributed. Conversely, the probabilistic approach takes into account the appliance's previous state and the probability of it changing state, and therefore exploits the sequential nature of the data.

This method is easily extended to a single appliance with more than two states, an approach which I intend to explore in the near future. This method can also potentially be extended to many appliances with multiple states, an approach that I intend to explore in the more distant future.

Friday, 6 May 2011

Data simulation using concurrent independent Markov chains of latent variables

As explained in previous posts, we can model the conditional probabilities of appliance states and aggregate power readings using a Markov chain of latent variables:

where:
  • Zt - discrete latent variable at time t (appliance state)
  • Xt - continuous observed variable at time t (power reading)

This model can be manually trained by specifying the model parameters:

  • pi - probability density of z1 (probabilities of initial appliance states)
  • A - appliance transition probability matrix
  • phi - emission density (probability density of observed variable given a hidden variable)
The model can then be used to simulate the states of an appliance and its power demand over time.

This is trivially extended to multiple appliances by using multiple concurrent Markov chains. However, this makes the assumption that appliance operations are independent of each other. Aggregate readings would be calculated by summing over each chain's observed variable for each time slice. Gaussian noise can be added to such a model using an additional Markov chain of latent variables, in which the latent variable is discrete and has only one state and the emission density represents the noise. This is equivalent to the factorial hidden Markov model below:
where:
  • Zt (1...n) - discrete latent variable at time t (appliance state)
  • Zt (0) - discrete latent variable at time t (meter noise source)
  • Xt - continuous observed variable at time t (power reading)

Thursday, 28 April 2011

Classification a single appliance's state using a hidden Markov model

The simplest scenario is one in which we wish to determine the state of a single two-state appliance, given its power demand. This can be represented as a hidden Markov model as follows:
where:
  • Zt - hidden (latent) variable at time t (appliance state)
  • Xt - observed variable at time t (power reading)
For a given set of observed variables, we can expand the possible chains of hidden variable states as a lattice diagram:
where:
  • k - appliance state
It can be seen from this diagram that the number unique chains of hidden variables through this lattice scales exponentially with the length of the chain. However, the max-sum algorithm (called the Vertibi algorithm in this case) can be used to find the probability of the most likely chain, with complexity that grows only linearly with the length of the chain. The values of the most likely chain can then be found by backtracking through the chain starting from the final time slice of the most likely chain.

The Viterbi algorithm involves calculating the joint probability of a chain of observed and hidden variables, given by:
where:
  • X - set of observed variables
  • Z - set of hidden variables
  • theta = {pi, A, phi} - model parameters
  • pi - probability density of z1
  • A - appliance transition probability matrix
  • phi - emission density (probability density of observed variable given a hidden variable)
  • N - number of time slices
The model parameters parameters can be learnt from the set of observed variables using the Expectation-Maximisation algorithm. However, we may want to introduce a prior belief over some parameters, or even fix some parameters. For example, we might know the state of the appliance at the start of the chain, and can therefore fix pi. We might also know the parameters governing the emission density, and if we assume the observations are normally distributed we might want to fix the mean and variance parameters of the Gaussian function.

Although this model can represent appliances with more than two states, it is unclear how tractable the EM algorithm will be for a factorial hidden Markov model. One solution would be to model the multiple Markov chains as a single Markov chain, whose number of states is equal to the number of combinations of appliance states. However, the complexity of such a model is then exponential in the number of appliances. It is worth noting that we can prune the number of possible transitions based on the assumption that only one appliance can change state between two consecutive time slices, which is a practical assumption assuming a small time interval between time slices. A solution to solving this might be to use sampling methods.